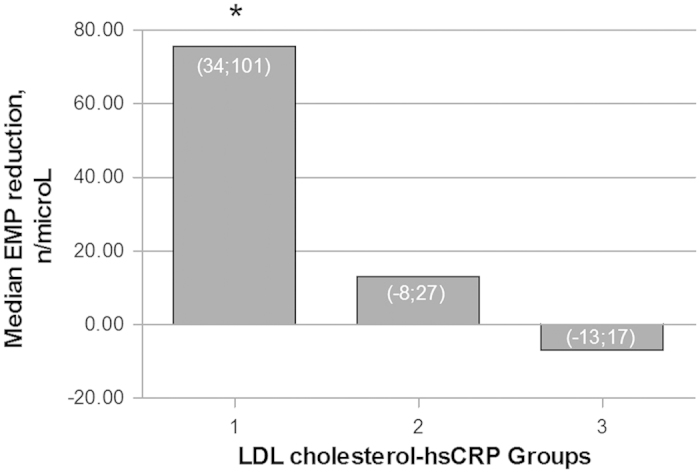
Figure 1. Post-intervention median EMP reduction according to the degree of LDL cholesterol and hsCRP changes.

Group 1 includes patients with both LDL cholesterol and hsCRP reductions. Group 2 includes patients with either a LDL cholesterol or hsCRP reduction. Group 3 includes patients without evidence of LDL cholesterol and hsCRP reduction. *p < 0.001 for comparisons between Group 1 and Groups 2 and 3. Values inside the bars indicate the interquartile ranges.
