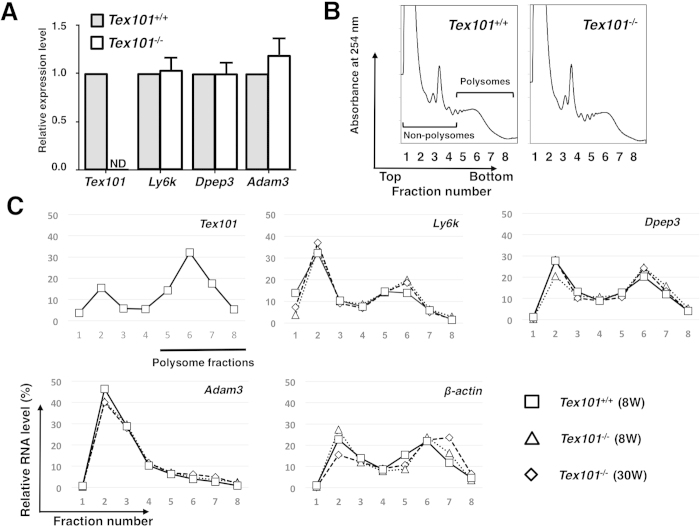
Figure 1. Differences of testicular gene expression between Tex101+/+ and Tex101−/−mice.
Analysis of Tex101, Ly6k, Dpep3, and Adam3 mRNA expression in the Tex101−/− mice (A). Levels of these mRNA expressions in the testes of Tex101+/+ (n = 3) and Tex101−/−(n = 4) mice were measured using qRT-PCR with SYBR Green method. To obtain the ΔΔCt values for the calculation of fold increases, β-actin mRNA was used as a quantitative internal control. Average of each mRNA expression level in Tex101+/+ mouse testis was defined as “relative expression value = 1.0”. The data are indicated with SE. ND: not detectable. Polysome profiles (254 nm absorbance profile) of sucrose gradient sedimentation of cell extracts from the Tex101+/+ and Tex101−/−mice testes (B). Detergent-treated cell extracts were fractionated over a 15–60% sucrose density gradient into eight fractions of equal volume. Expression levels of testicular Tex101, Ly6k, Dpep3, Adam3, and β-actin mRNAs from the 8-week Tex101+/+ and 8- or 30-week-old Tex101−/−mice in each fraction of the sucrose gradients (C). Each fraction number corresponds to that in the absorbance profile shown in (B). Data are graphically represented as ratio of transcripts from a typical experiment, present in each fraction to the sum of all fractions. As an external standard, r-luc mRNA was used.

