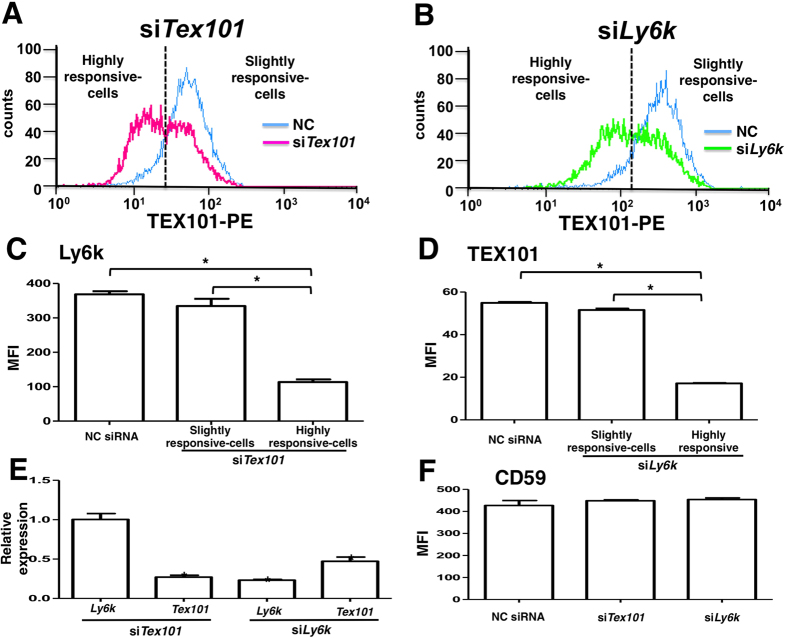
Figure 4. Effects of siRNAs against Tex101 and Ly6k genes on the expression of those molecules in 293mTx/ly6kκB cell line.
After transfected with each siRNA and sequentially incubated for 48 h in a 5% CO2 humidified atmosphere at 37 °C, the 293mTx/ly6kκB cells were harvested. Expression levels of TEX101 and Ly6k on the transfected cell surfaces were measured by flow cytometry. Histograms of the cells transfected either Tex101 (A), or Ly6k (B) siRNA. Blue lines represent the histogram of NC siRNA transfected cells. The left sides peak of dotted lines contain cells that are highly responsive for siTex101 (A) or siLy6k (B), respectively. The other side peaks contain cells that are slightly response for each siRNA. Expression of Ly6k (C) and TEX101 (D) in the 293mTx/ly6kκB cells transfected with NC, Tex101, or Ly6k siRNA. The data are expressed as the mean fluorescence intensity (MFI) with SE measured by flow cytometry (n = 3). *p < 0.05. Changes in mRNA expression levels of Ly6k and Tex101 in the TEX101- or Ly6k siRNA-transfected 293mTx/ly6kκB cells (E). The mRNA expression levels were measured by the qRT-PCR analysis with SYBR Green method. Relative expression values were normalized with the Rps18 expression and the normalized values of each mRNA expression in the transfected cells with NC siRNA are defined as “1.0”. Values are shown as means with SE (n = 3). *p < 0.05 compared to the control (NC siRNA transfection). Effects of Tex101 and Ly6k siRNAs on CD59 expression (F). After 293mTx/ly6kκB cells were transfected with NC siRNA, siTex101, or siLy6k and then incubated, CD59 expression levels were analyzed by flow cytometry. The data shown are the MFI with SE (n = 3).

