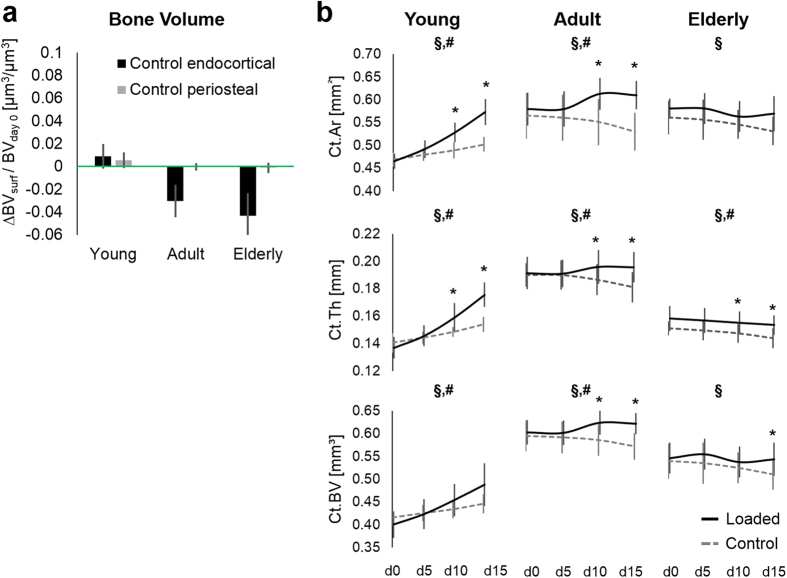
Figure 2.
(a) Changes in endocortical and periosteal bone volume normalized to total bone volume (BV) of day 0 over the two weeks of the experiment (∆ BV) in the control limb (left). (b) Monitoring of static parameters over 2 weeks of loading. Cortical area (Ct.Ar.), thickness (Ct.Th) and total bone volume (Ct.BV) Ct.Ar. and Ct.Th. for a subset of 10 and 26 week old mice have been previously analyzed in a similar region of the unregistered data sets17. *Significant difference loaded vs. control. §Significant difference control limbs day 0 vs. day 15. #Significant difference loaded limbs day 0 vs. day 15, t-tests p < 0.05.

