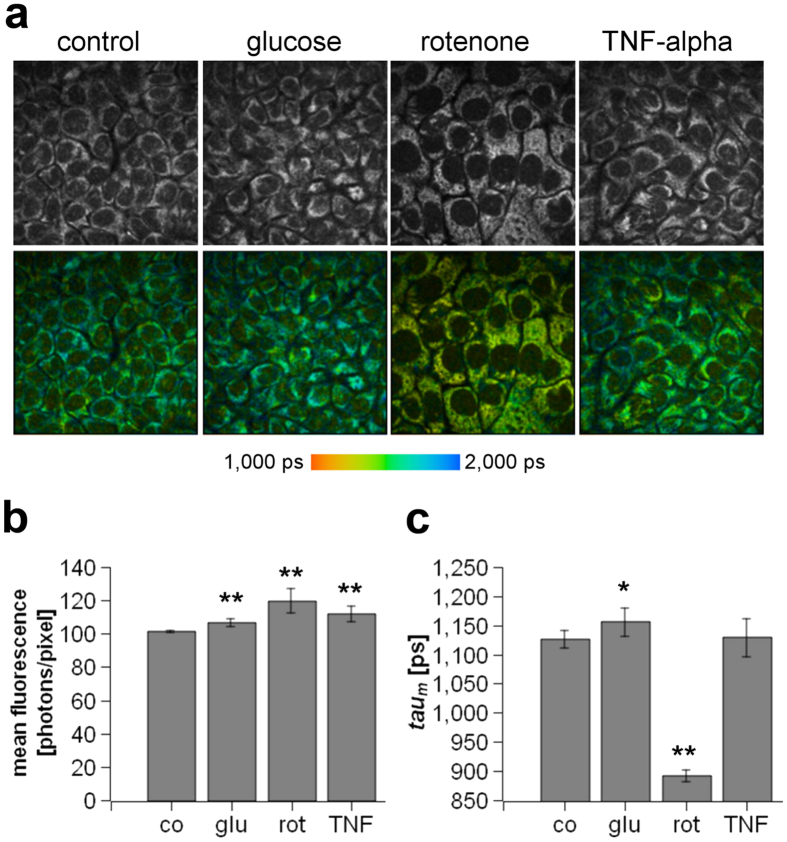
Figure 6. Evaluation of the energy status of human keratinocytes in vitro.
(a) Fluorescence intensity images reflecting the total amount of cellular NADH (first row) and fluorescence lifetime images (FLIM) (second row) of non-treated keratinocytes (control) or keratinocytes treated either with 20 mM glucose, 5 μM rotenone or 10 nM TNF-alpha. The colour-coded bar reflects the fluorescence lifetime, ranging from 1,000 ps (red) to 2,000 ps (blue). (b) Quantification of the mean fluorescence intensity of non-treated keratinocytes (co) or keratinocytes treated with glucose (glu), rotenone (rot), or TNF-alpha (TNF). (c) Quantification of the mean fluorescence lifetime (taum) of non-treated keratinocytes (co) or keratinocytes treated with glucose (glu), rotenone (rot), or TNF-alpha (TNF). *P < 0.05, **P < 0.01.

