
Figure 8. Overall fluorescence lifetime (taum) in the course of the clinical trial.
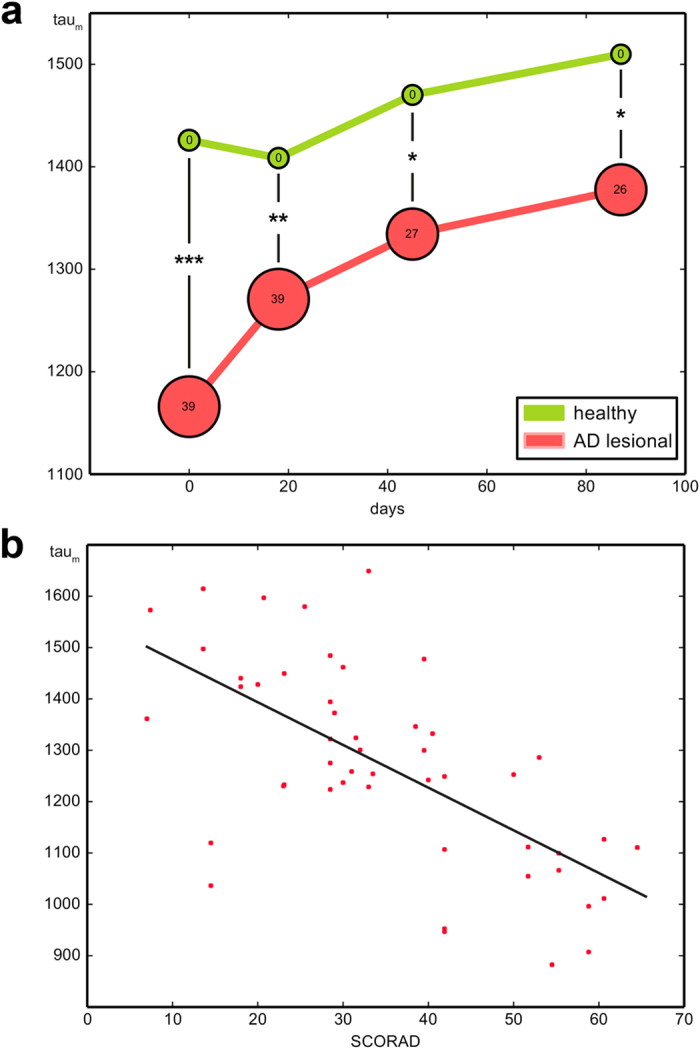
(a) Mean taum values of lesional skin areas in all patients suffering from AD continuously show a significant difference in the taum of healthy skin over the entire term. The bubble size represents the disease severity measured via SCORAD. (b) Plotting the taum of lesional skin against the corresponding inflammatory state measured via SCORAD, a significant linear correlation is revealed: taum decreases with increasing SCORAD.