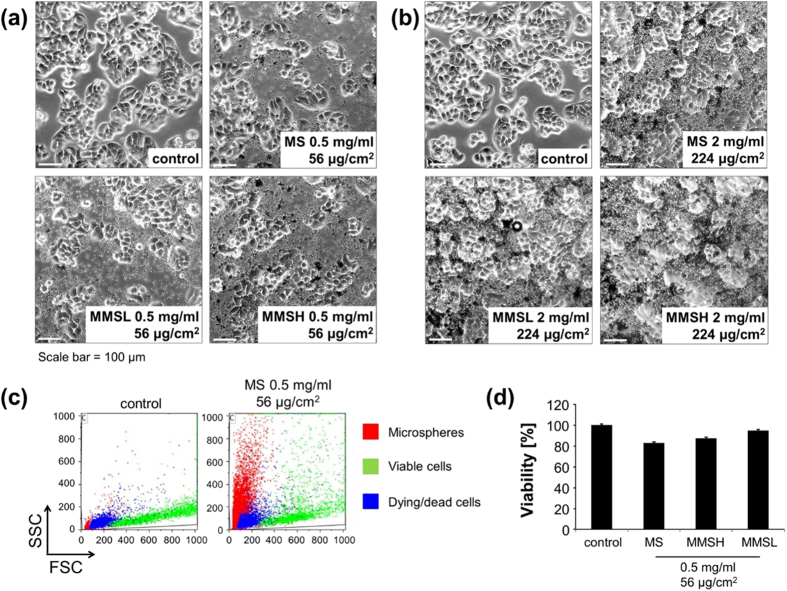
Figure 10. Biocompatibility of MS, MMSL and MMSH on adherent HT-29 cells.
Experiments were performed in triplicates, shown are the mean values with standard deviations. HT-29 cells were seeded into cell culture wells (6 well plates; growth area 8.9 cm2, 1 mL medium), grown for 24 hours and incubated with microspheres for 24 h. (a,b) Transmission microscope images (magnification 10×) of HT-29 cells incubated with (a) 0.5 mg/mL microspheres or (b) 2 mg/mL microspheres for 24 h. (c) Flow cytometry raw data file (Forward scatter versus side scatter) depicts possibility to discriminate between microspheres (red), viable (green) and dying/dead cells (blue) by morphological parameters; (d) analysis of cell viability by morphology and mitochondrial membrane potential. Viability of control cells was set to 100%; experiment was performed in triplicates; shown are the mean values with standard deviations.

