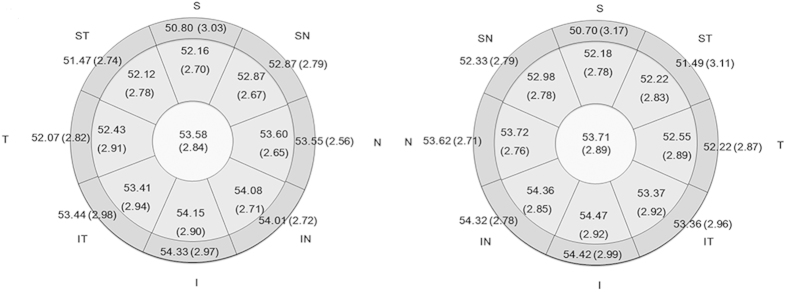
Figure 1. Pachymetry map for corneal epithelium thickness measured by RTVue Fourier optical coherence tomography for 614 Chinese children in right (Left) and left eyes (Right) (Mean (standard deviation), μm).
S: Superior, ST: Superior Temporal, ST: Temporal, IT: Inferior Temporal, I: Inferior, IN: Inferior Nasal, N: Nasal, SN: Superior Nasal.

