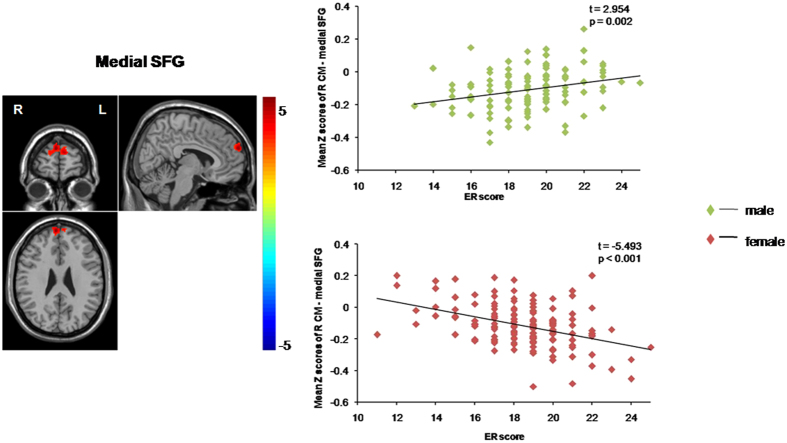
Figure 1. Functional connectivity pattern between the right CM and the medial SFG and the correlation with ER scores.
Scatter plots showing ER-related changes in RSFC in the male and female groups, separately. The lines are linear fits of the data. Abbreviations: CM, centromedial subregion; medial SFG, medial superior frontal gyrus; ER: emotion regulation; RSFC, resting-state functional connectivity; L, left; R, right.

