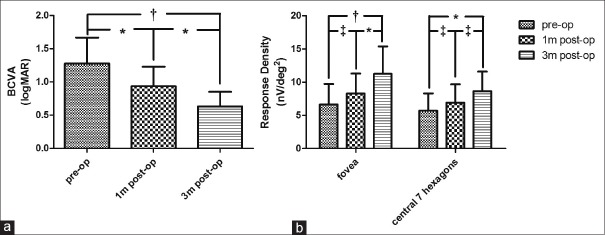
Figure 4.
Longitudinal evaluations of best corrected visual acuity and multi-focal electroretinogram responses. As shown in figure, increasing trends in best corrected visual acuity (a) and multi-focal electroretinogram responses (b) were observed during the first 3 months after srugery. One-way analysis of variance and Tukey's multiple post-hoc comparison tests were used for analysis for visual acuity (a), and two-way analysis of variance with Bonferroni post-hoc tests were used for comparions between multi-focal electroretinogram responses at different time points (b). Results of statistical analysis were indicated (P < 0.01 and P < 0.001 were defined as significant [*] and very significant [†], respectively; [‡] means not significant). BCVA: Best corrected visual acuity, logMAR: Logarithm of the minimum angle of resolution. pre-op: Preoperative; 1m post-op: Postoperative 1 month; 3m post-op: Postoperative 3 months.

