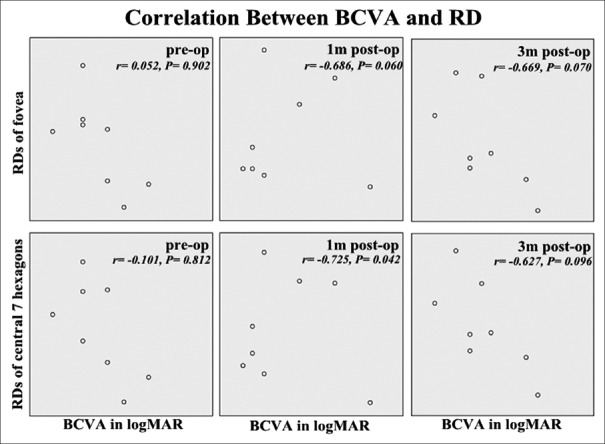
Figure 5.
Associations between best corrected visual acuity in logarithm of the minimum angle of resolution and response densities of fovea or central 7 hexagons at base line (pre-op), 1 month after surgery (1 m post-op) and 3 months after surgery (3 m post-op). Pearson test coefficients (r) and P values were demonstrated in each plot. Although improvement could be observed with time for both paremeters, there was no clear correlation between best corrected visual acuity and multi-focal electroretinogram responses at each evaluation time point, and retinal response densities varied in patients even with the same best corrected visual acuity (P < 0.01 was defined as significant). BCVA: Best corrected visual acuity, RD:Response density, logMAR: Logarithm of the minimum angle of resolution.

