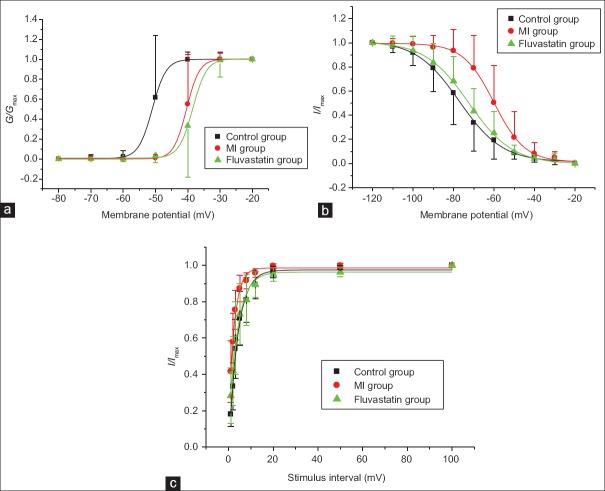
Figure 3.
Effects of myocardial ischemia and fluvastatin on activation and inactivation process of INa. (a) Effects of myocardial ischemia and fluvastatin on activation process of INa. The half-activation voltages of the activation curves of control group, myocardial ischemia group, and fluvastatin group were −50.99 ± 0.18 mV, −40.39 ± 0.12 mV, and −38.45 ± 0.26 mV (n = 10 in each group, F = 16.087, P < 0.001), and the slope factors were 2.13 ± 0.34 mV, 1.99 ± 0.48 mV, and 2.13 ± 0.31 mV (n = 10 in each group, F = 1.910, P = 0.168). (b) Effects of myocardial ischemia and fluvastatin on inactivation process of INa. The half-inactivation voltages of the inactivation curves of control group, myocardial ischemia group, and fluvastatin group were −77.16 ± 0.47mV, −60.00 ± 0.34 mV, and −72.50 ± 0.45 mV (n = 10 in each group, F = 0.848, P = 0.440), and the slope factors were 10.67 ± 0.44 mV, 7.59 ± 0.31 mV, and 10.74 ± 0.44 mV (n = 10 in each group, F = 14.115, P = 0.036). (c) Effects of myocardial ischemia and fluvastatin on recovery curves after inactivation of INa. The time constants of the recovery curves after inactivation in control group, myocardial ischemia group, and fluvastatin group were 3.96 ± 0.35 ms, 2.55 ± 0.31 ms, and 4.02 ± 0.42 ms (n = 10 in each group, F = 2.704, P = 0.045). Each point represents mean ± standard deviation.

