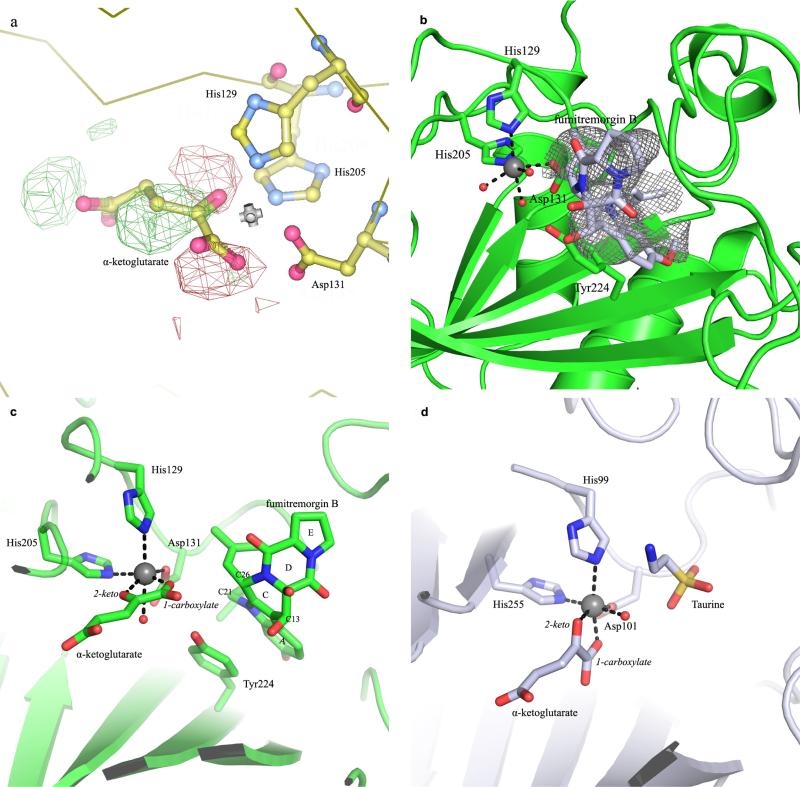
Extended Data Figure 5. Structural comparison of the active site topologies between FtmOx1 and TauD.
a, Examination of the alternative configuration of α -KG in the FtmOx1–α -KG binary complex using the configuration of α -KG in the TauD–α -KG binary complex. We modelled α -KG in this alternative binding mode and calculated the difference map. In the Fo – Fc map, strong positive density (green) and negative density (red) are shown even when contoured to high level (3.3σ), indicating that this configuration is not correct for the FtmOx1–α -KG complex. b, The Fo – Fc map at the active site of the FtmOx1–fumitremorgin B complex. A model of the substrate fumitremorgin B is superimposed onto the difference map, which is contoured at 2.8σ. c, Side-by-side comparison of FtmOx1 and TauD active-site topologies. In the left panel, the superimposition of the binary structures of FtmOx1–α -KG and FtmOx1–fumitremorgin-B (1) show that the remaining site for oxygen binding and activation is blocked from the substrate by Y224. d, In contrast, in the structure of the TauD–taurine–α -KG tertiary complex, the remaining site for O2 binding and activation directly faces the substrate (taurine).

