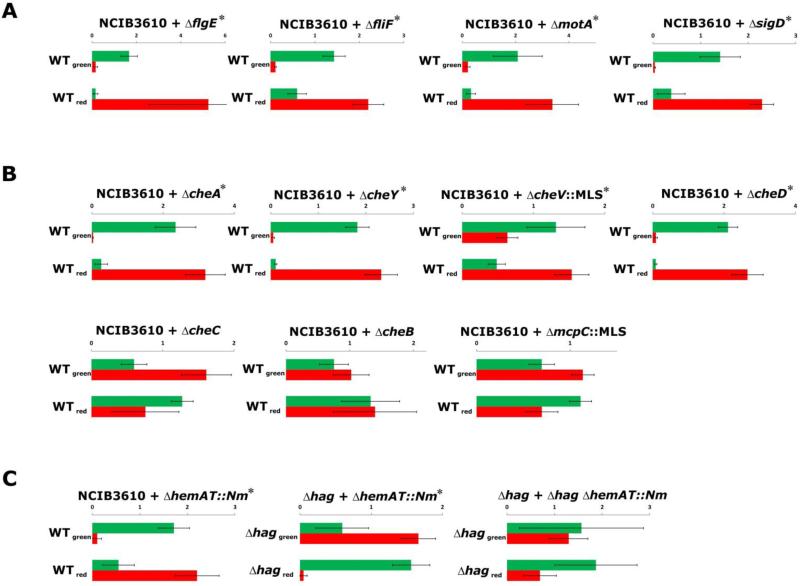
Fig. 4.
Competition of GFP- or mKATE2-labelled B. subtilis strains during pellicle formation. Mutants are categorized by the locus’ involvement in (A) flagellum biosynthesis and regulation, (B) chemotaxis, or (C) aerotaxis. Relative fluorescence levels (arbitrary units are shown on the axis) were quantified in a fluorescence plate reader and are shown with bar charts (n=4). Green and red bars indicate relative GFP and mKATE2 levels, respectively. In each graph, the upper bars represent the mix of NCIB3610GFP and mutantmKATE2 strains (WTgreen), while the down bars represent the mix of NCIB3610mKATE2 and mutantGFP strains (WTred). Error bars indicate standard deviation. Significant differences (Student's T-test p<0.05, see Materials and Methods) are indicated with a star next to the strains used for competitions.

