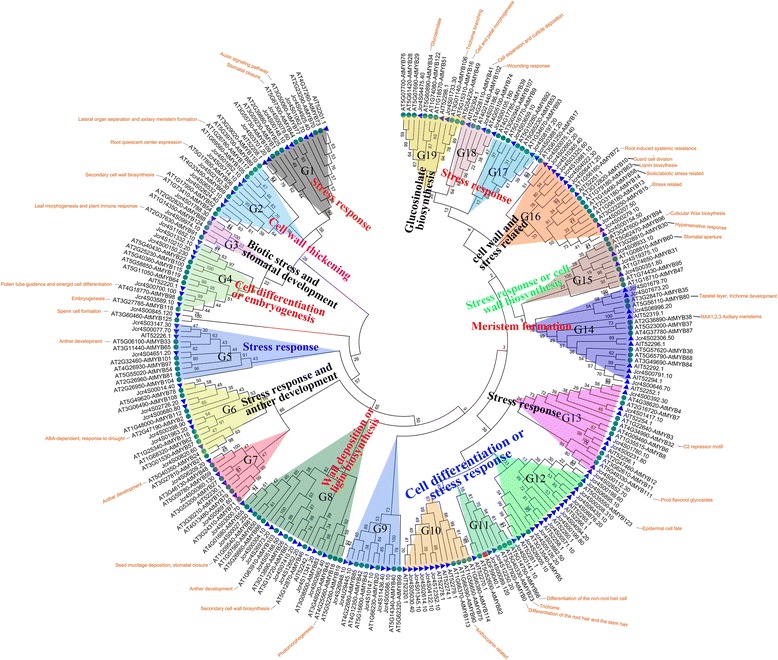
Fig. 1.

Evolutionary relationships of JcR2R3-MYB. The evolutionary history was inferred using the Neighbor-Joining method. The statistical method is Maximum Likelihood (ML). The bootstrap consensus tree inferred from 1000 replicates is taken to represent the evolutionary history of the MYBs analyzed. The evolutionary distances were computed using the p-distance method and are in the units of the number of amino acid differences per site. The analysis involved 249 amino acid sequences. Evolutionary analyses were conducted in MEGA5.2. Among of these, JcMYB2 is a member of group 11 and identified by the red square
