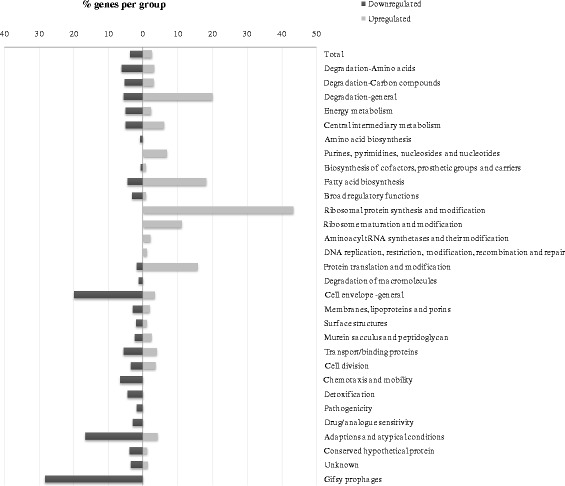
Fig. 4.

Functional classification of the differentially expressed genes in the isogenic fabR deletion mutant as compared to the wildtype under free-living TSB conditions. The bars represent the percentage of genes belonging to each group that were altered for absolute expression > 1.3 fold with a p-value < 0.02. The functional classes defined by the Welcome Trust Sanger Institute were used for this classification and the numbers behind each class represent the number of genes in this class
