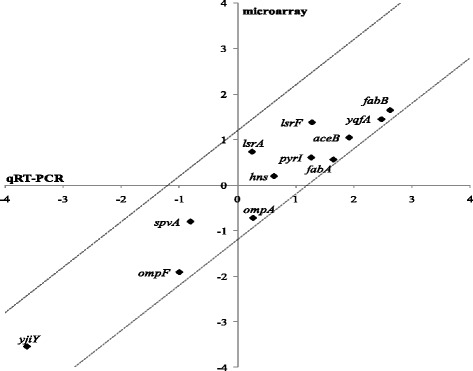
Fig. 5.

Comparison between the microarray and qRT-PCR data. The expression of a number of genes was determined using qRT-PCR for the S. Typhimurium SL1344 wildtype and SL1344 ∆fabR mutant under free-living TSB conditions. The log2-transformed mean value of at least three qRT-PCR technical repeats (representative for each of the two assayed biological replicates) for each gene was plotted on the X-axis and compared to the respective log2-transformed microarray fold change (Y-axis). All depicted qRT-PCR tested genes had a p-value < 0.02 under their respective microarray conditions and their qRT-PCR primers are listed in Additional file 1: Table S2. The dotted lines represent arbitral boundaries (y = x + 1.2 and y = x – 1.2) between which the corresponding qRT-PCR and microarray results show good correspondence (i.e. not more than a 1.2 fold divergence on log2 scale) with y = x being the ideal situation
