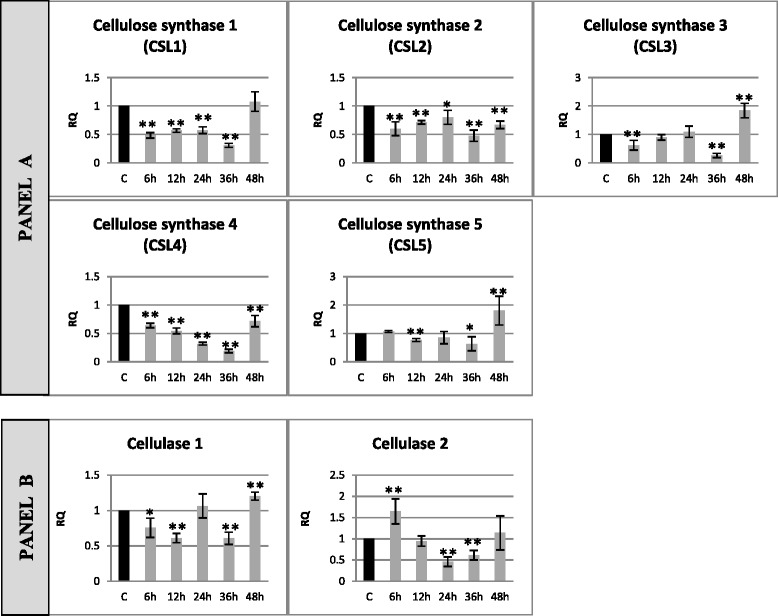
Fig. 2.

Relative expression of cellulose metabolism gene transcripts in flax seedlings infected with Fusarium oxysporum. Changes in expression levels of genes: cellulose synthesis (cellulose synthase isoform 1–5) – panel a and cellulose degradation (cellulase 1 and cellulase 2) – panel b in flax seedlings treated with pathogenic strains of F. oxysporum (F.ox.) at 6, 12, 24, 36 and 48 h after inoculation were presented as relative quantity (RQ) relative to reference gene (actin) in relation to control (C). The data were obtained from real-time RT-PCR analysis. The data represent the mean ± standard deviations from three independent experiments. The significance of the differences between the means was determined using Student’s t test (*P < 0.05, **P < 0.01)
