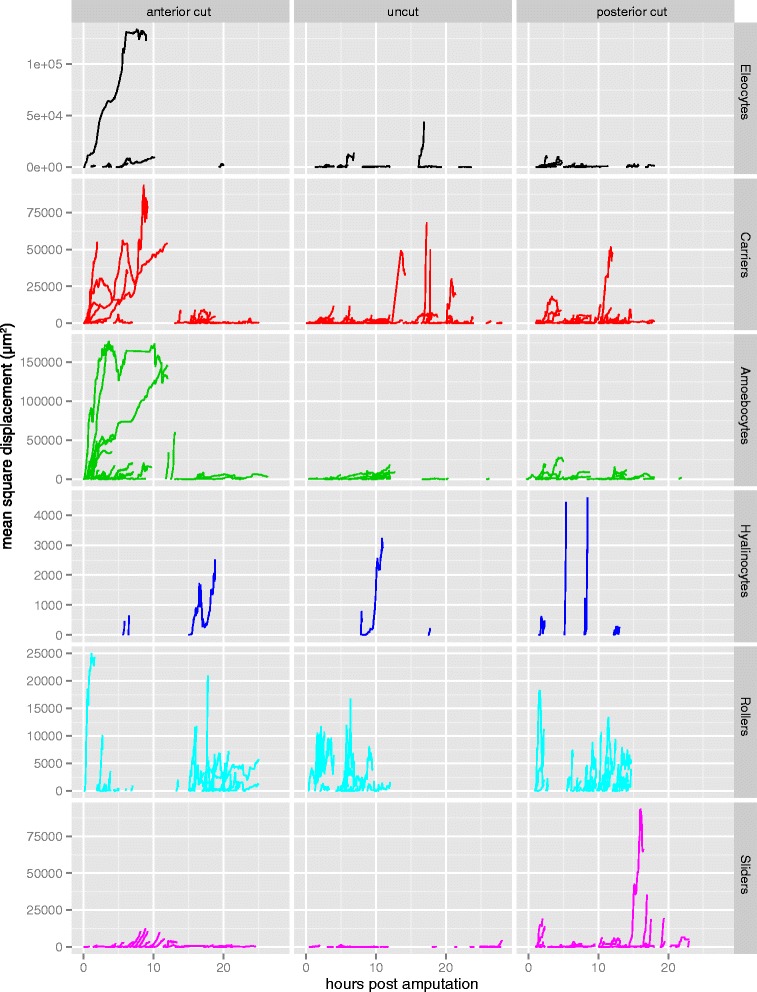
Fig. 5.

Mean square displacement of individual cell trajectories across time (hours post amputation; hpa), for all three treatments (columns) and six cell types (rows). Overall displacement of migrating cells is highly variable within and between cell types, treatments, and developmental time. Note that the vertical axis scale varies between rows
