
Fig. 6.
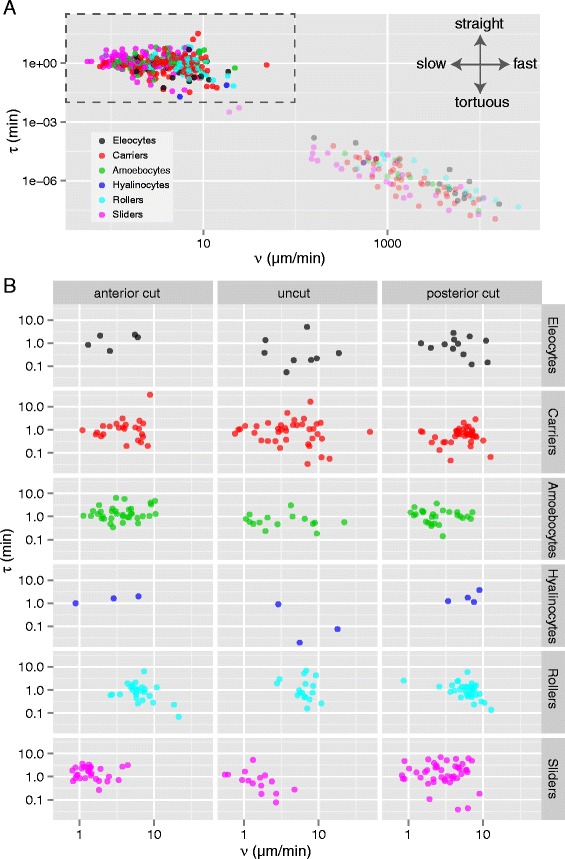
Speed and directional memory of individual cell trajectories. Most cell types show a similar range of speeds and directional memory. a Scatterplot of the timescale of autocorrelation (τ, in min) versus mean tangential speed (ν, in μm/min) for all cell types. Note that both axes are shown in log10 scale. b Scatterplots of τ versus ν for individual treatments (rows) and cell types (columns) for all cells within the boxed area in a