Fig. 1.

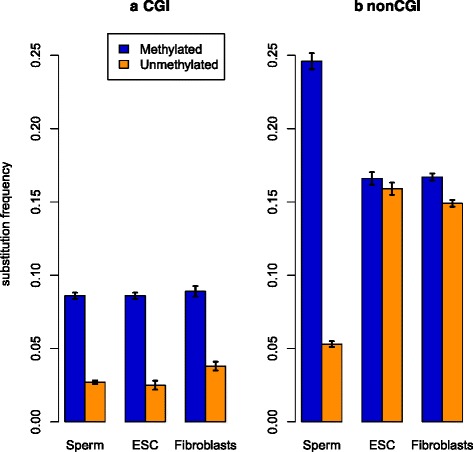
CpG > TpG substitution rates in methylated and unmethylated positions of CGIs (a) and non-CGI (b) regions. Confidence intervals are calculated according with one-sample t-test for deviation from the population mean (α = 0.00001)

CpG > TpG substitution rates in methylated and unmethylated positions of CGIs (a) and non-CGI (b) regions. Confidence intervals are calculated according with one-sample t-test for deviation from the population mean (α = 0.00001)