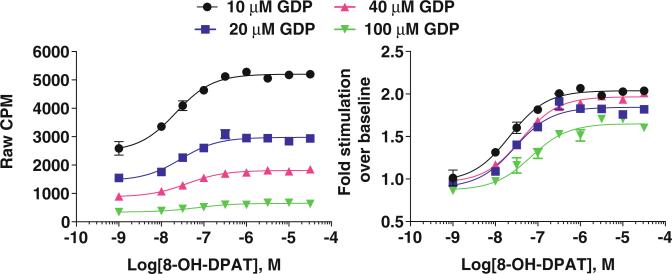
Fig. 3.
Examples demonstrating the effect of GDP concentration of basal signaling levels in rat hippocampus membrane preparations and how this influences the determination of the fold stimulation. In these samples, we opted to work with the 10 μM concentration of GDP. Hippocampus homogenates contained 2 μg protein per well, 100 pM and [35S]-GTPγS

