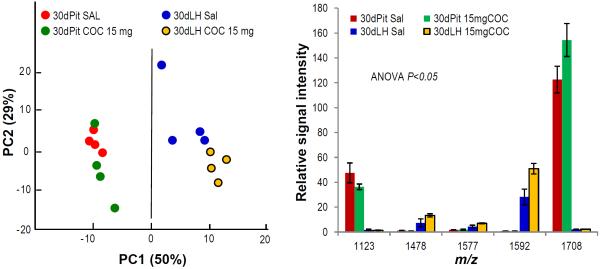
Fig. 5.
Cocaine induces peptide changes in the Pit and LH of adolescent FVB mice. (a) PCA plot for the first two PCs showing segregation of spectra by sample type and treatment according to peptide profile features. (b) Relative intensities of peptides detected at significantly different levels as determined by ANOVA; known peptides are: m/z 1577, excitatory amino acid transporter 1; m/z 1592, MBP; m/z 1708, di-Ac-α- melanocyte-stimulating hormone (m/z corresponds to maximum height at half width of the deisotoped centroid peak from the group mean spectrum as calculated by ClinProTools); remaining m/z are not identified.

