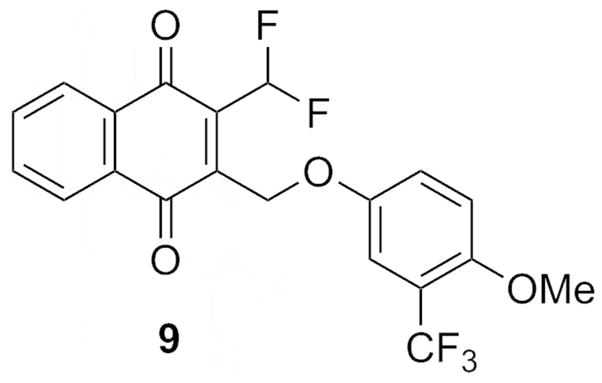
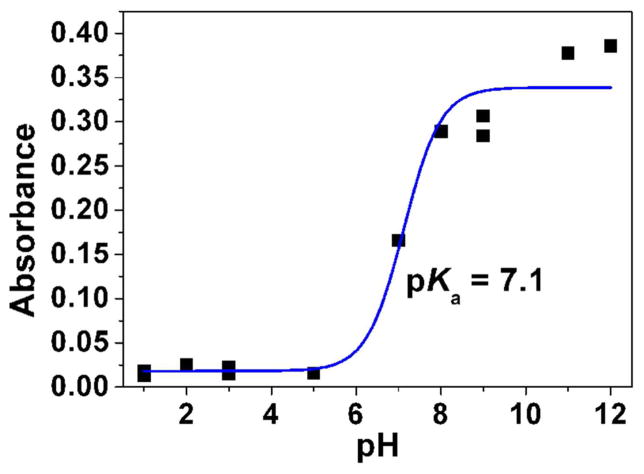
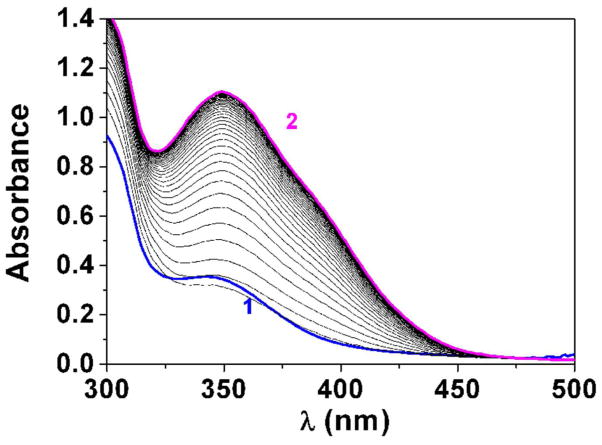
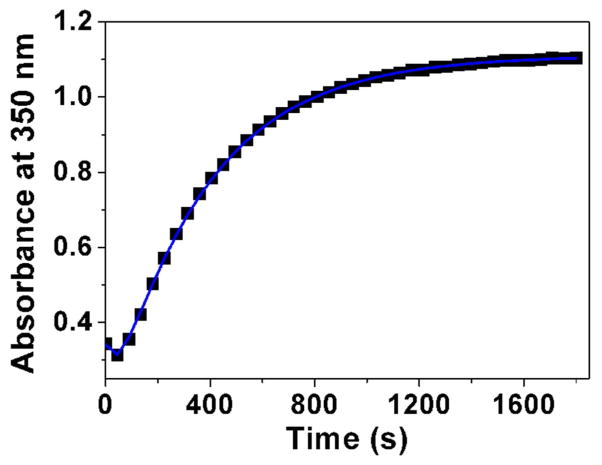
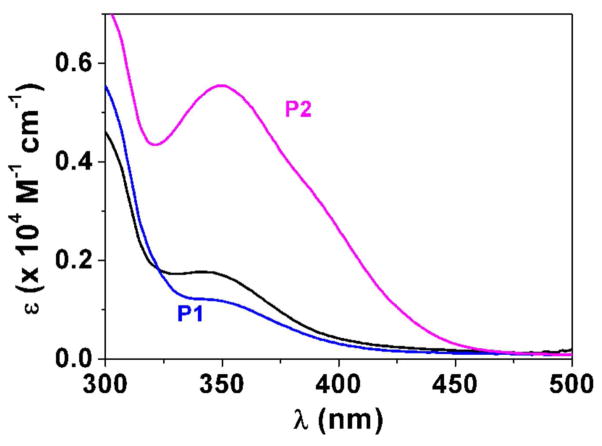
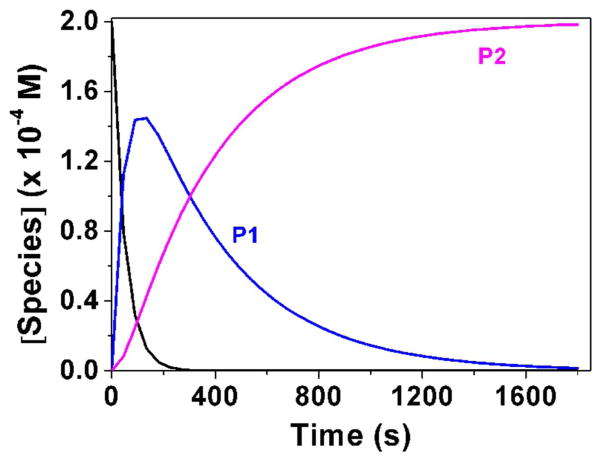
Fig. 3.
Determination of the pKa value (Panel A) and changes of the absorption spectra (Panels B-E) for the difluoromethyl derivative 9 (BJ735) upon glutathione addition. (B) Absorption spectrophotometric variation and (C) Absorbance at 350 nm measured in the time course of the glutathionylation reaction with the difluoromethyl derivative 9. Solvent: 200μL MeCN + 265 μL NH4OH buffer at pH 7.5; [9] = 2 × 10⁻⁴ M (10 μL stock at 10 mM); [GSH] = 10−3 M (25 μL stock at 20 mM); T = 25°C. (1) t = 0 s; (2) t = 1800 s. (D) Electronic absorption spectra measured for the difluoromethyl derivative 9 and its glutathione adducts and (E) Distribution diagram of the difluoromethyl derivative 9 and its products as a function of time upon the glutathionylation reaction. Solvent: 200μL MeCN + 265 μL NH4OH buffer at pH 7.5; [9] = 2 × 10⁻⁴ M (10 μL stock at 10 mM); [GSH] = 10−3 M (25 μL stock at 20 mM); T = 25°C.

