Fig. 4.
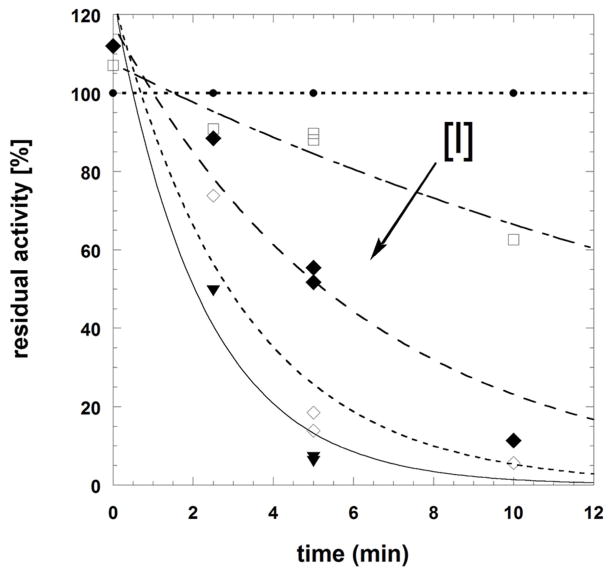
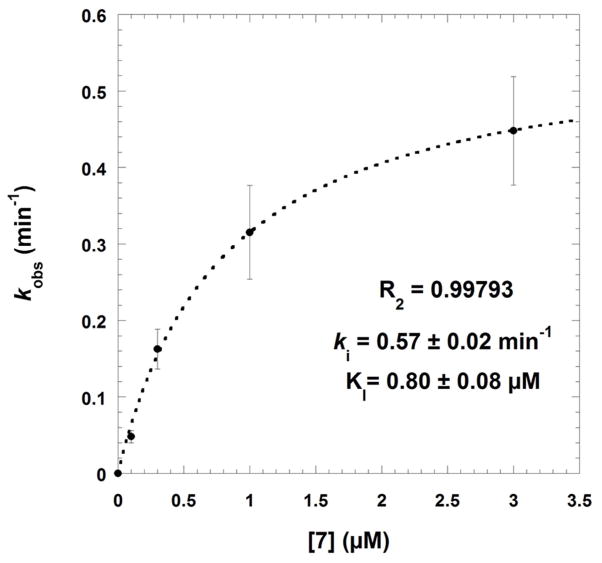
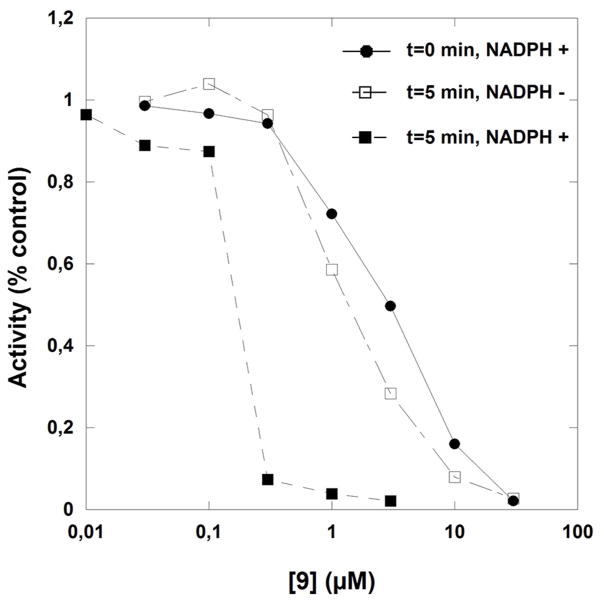
Time-dependent inactivation of Schistosoma mansoni thioredoxin glutathione reductase by compounds 7 (panels A and B) or 9 (panel C). Panels A-B: SmTGR (40 nM in 100 μL) was incubated in the presence of 100 μM NADPH and various inhibitor concentrations at 25°C for different times of incubation periods (0, 2.5, 5, and 10 min). Compound 7 concentrations used were 0 (●), 0.1(□), 0.3 (◆), 1.0 (◇), and 3.0 (▼) μM (panel A). The kobs data versus [I] were fitted to equation 5 (see text) which resulted in the hyperbolic curve (dashed line). At low inhibitor 7 concentration the dissociation constant and the first order rate constant for irreversible inactivation were determined as KI = 0.8 ± 0.08 μM and ki as 0.57 ± 0.02 min−1, respectively. Panel C: SmTGR (40 nM in 100 μL) was incubated in the presence of 100 μM NADPH and inhibitor at varying concentrations (0 – 0.03 – 0.1 – 0.3 – 1.0 – 3.0 – 10.0 – 30.0 μM) for 0 (●) and (■) 5 min-incubation periods. Reactions were also carried out in the absence of NADPH with the pre-reacted enzyme for 5 min (□). Then, 5 μL aliquots were removed and the remaining activity was measured in a standard DTNB reduction assay as described under Experimental Procedures. 3.4% final DMSO was present in all incubation mixtures.


