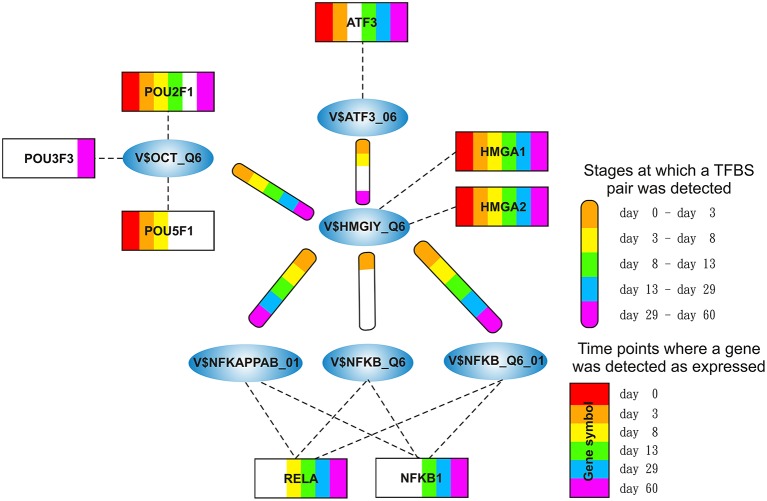
Figure 5.
Stage specific representation of TFBSs and the expression of associated TF genes, referring to Figure 2B. The encircled nodes represent the found TFBSs which are connected by color-coded round-edged rectangles which highlight stages where a TFBS pair was found. TF genes which are associated to TFBSs are linked by dashed lines. The TF genes are represented by color-coded rectangles representing the presence at a partiular time point. The absence of a TF gene during a particular time point or the absence of a pair during a particular stage is encoded in white. Both, the color-code for the stage specificity as well as for the gene expression of a TF gene is shown on the bottom right side. TF genes which are associated to a TFBS but are in all time points below the set threshold are omitted.

