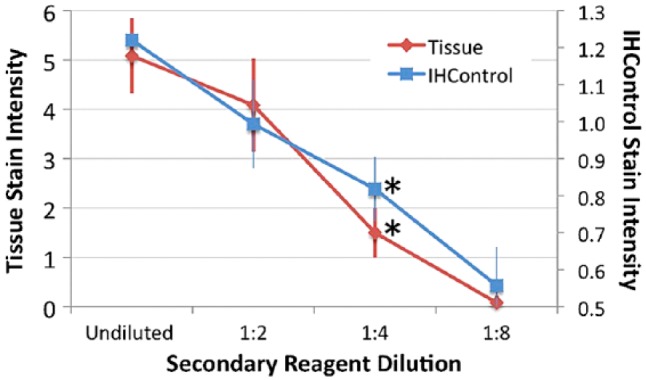
Figure 5.

Secondary antibody dilution (x-axis) versus stain intensity (y-axis) for HER-2, as measured using both tissue controls (antigen-high) and IHControls. Stain intensity for HER-2 tissue staining is represented on the left-hand vertical axis. Stain intensity of the IHControls is represented on the right-hand axis. For each data point, samples were tested in triplicates. The triplicate tissue controls are serial sections from the same paraffin tissue block. The graphs depict the mean +/- SD. The asterisks identify the dilution that results in a statistically significantly lower level of staining as compared to the baseline condition.
