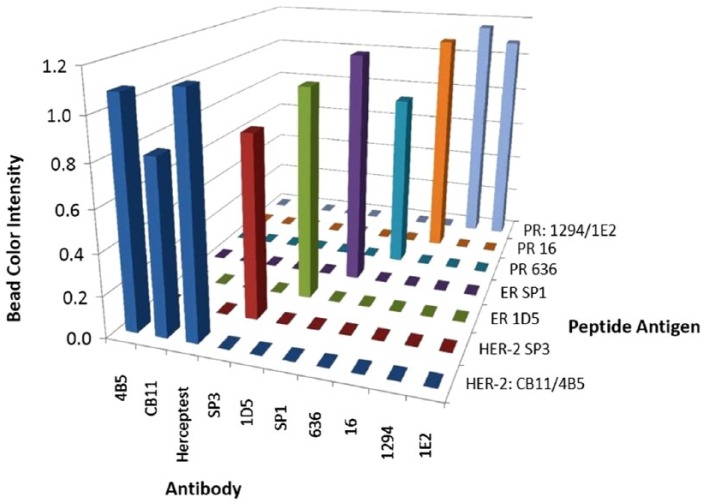
Figure 8.
Peptide antigens on the IHControl beads bind specifically to their cognate antibodies. Data from a “criss-cross” experiment, measuring the immunostaining intensity with various HER-2, ER, and PR antibodies with their corresponding peptide antigens. The vertical bars represent the mean stain intensity, as measured using image analysis. The fact that there was no detectable color in the unstained beads made it difficult to obtain an actual number by image analysis, as the MatLab algorithm automatically located and distinguished stained beads from unstained beads by the presence of stain. Even after lowering the detection threshold, the program could not distinguish any color on the beads. Therefore, a value of “zero” was entered for unstained beads. The values are the means of triplicates.

