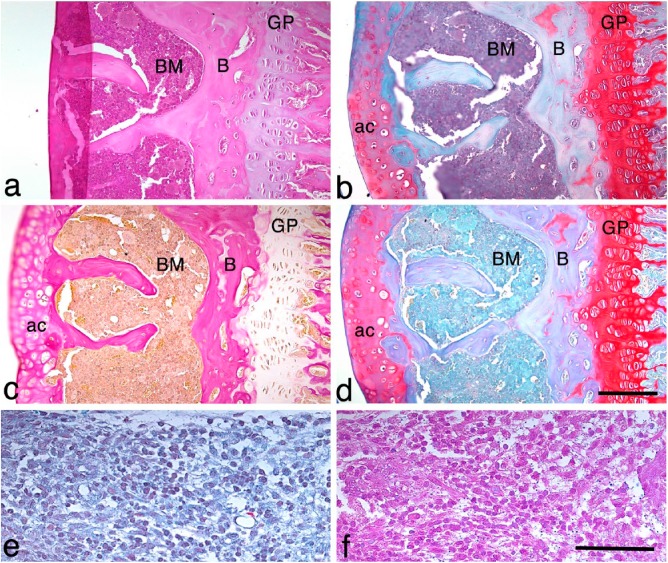
Figure 2.
Comparisons of the single stains of H&E, van Gieson’s and Safranin O with the BIC stain. Serial sections of a knee joint from a mouse with a mild case of septic arthritis stained with (a) H&E stain, (b) BIC stain, (c) van Gieson’s stain and (d) Safranin O stain. Abbreviations: ac, articular cartilage; B, bone; BM, bone marrow; GP, growth plate. Scale, 120 μm. (e, f) An area of synovitis showing the inflammatory cell infiltrate using BIC (e) and H&E (f) staining. Scale, 100 μm.

