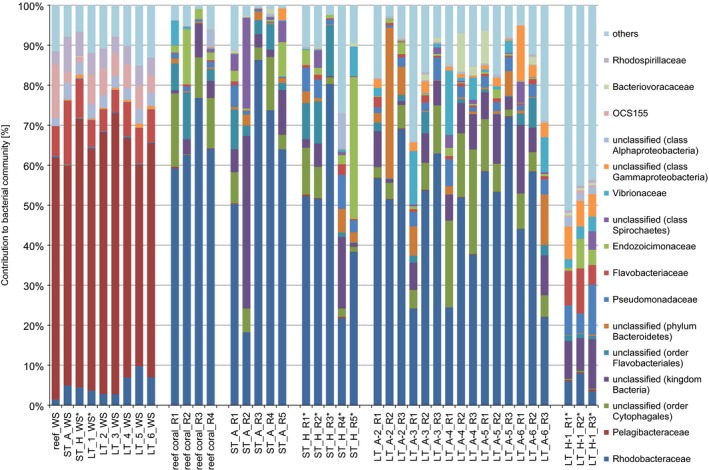
Figure 1.

Bacterial taxonomy stack plot on the phylogenetic level of family (greengenes database, bootstrap ≥60). Each colour represents one of the 16 most abundant families in all samples. All other taxa are grouped under category ‘others’. ST, short‐term incubation; LT, long‐term treatment; A, ambient; H, hypersaline; numbers in the LT sample names denote transect station; WS, water sample; asterisks denote hpersaline samples.
