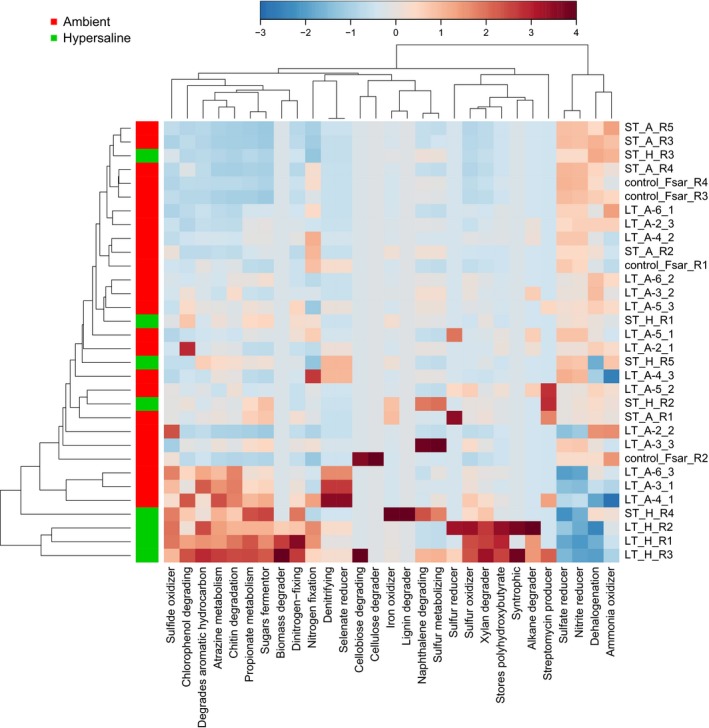
Figure 3.

Taxonomy‐based functional profiling of bacterial communities. Heatmap created in metagenassist displaying changes in putative functional profiles based on the 16S community composition. Changes are displayed on a relative scale with enrichment in red and depletion in blue. Data were analysed for metabolism by phenotype with an Euclidean distance measure and average clustering algorithm. ST, short‐term incubation; LT, long‐term treatment; A, ambient; H, hypersaline; Numbers in the LT sample names denote transect station.
