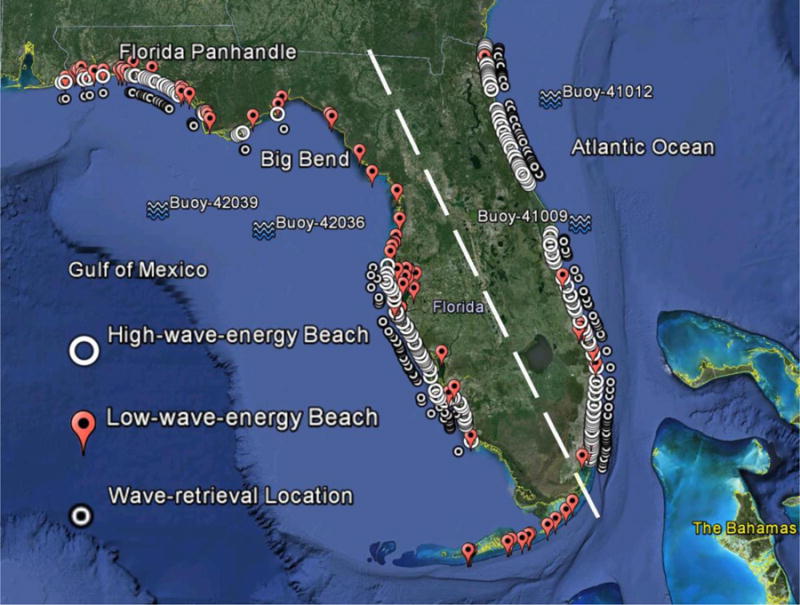
Figure 1.

All 262 Florida recreational beaches in this study. Four National Data Buoy Center (NDBC) buoys (for wave observations) are illustrated by wave symbols. Locations of high- and low-wave-energy beaches and wave-retrieval locations (for high-wave-energy beaches) are demonstrated using white circles, red balloons, and black dots. The white dashed line separates Atlantic Ocean and GoM beaches. Big Bend and western Florida Panhandle are identified as water quality hotspots where some recreational beaches frequently exceed enterococci or fecal coliform thresholds. Base map is outputted from Google Earth Pro.
