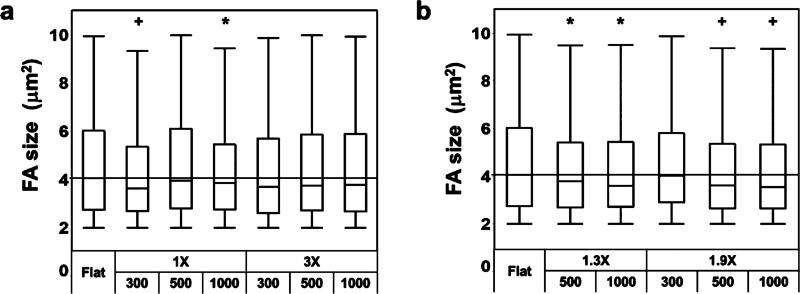
Figure 4.
Focal adhesion sizes of fibroblasts on the nanotopographies of 150 nm in height. Box plots of focal adhesion size on (a) nanogratings and (b) nanopillars. The straight horizontal lines indicate the median focal adhesion size on the flat control (4.1 ± 0.1 μm2). Significant difference from the flat controls is indicated by * where p < 0.05 and + where p < 0.001.

