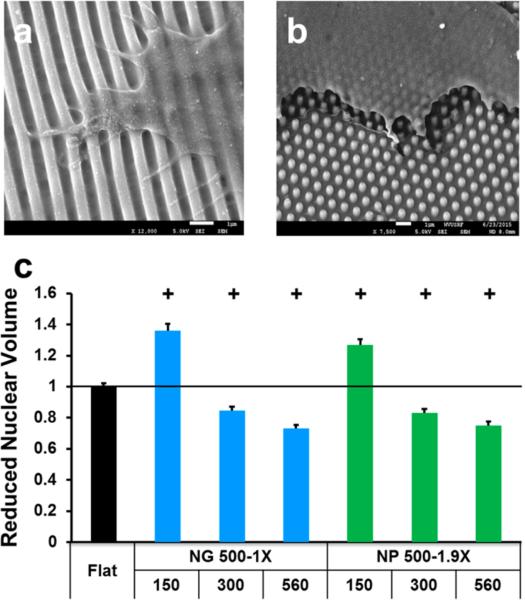
Figure 6.
Effects of nanotopography height on cell spreading and nuclear volume. SEM micrographs of fibroblasts grown on (a) NG 500-1X-560 and (b) NP 500-1.9X-560. Scale bars are 1 μm. (c) Height-dependent nuclear volume. The first and second rows of x-axis labels provide the lateral dimensions and the height (both in nm) of nanotopographies. Significant difference from the flat controls is indicated by + where p < 0.001.

