
Extended Data Figure 3. 3D cryo-EM density map of the tetrameric InsP3R1 visualized in three orthogonal orientations.
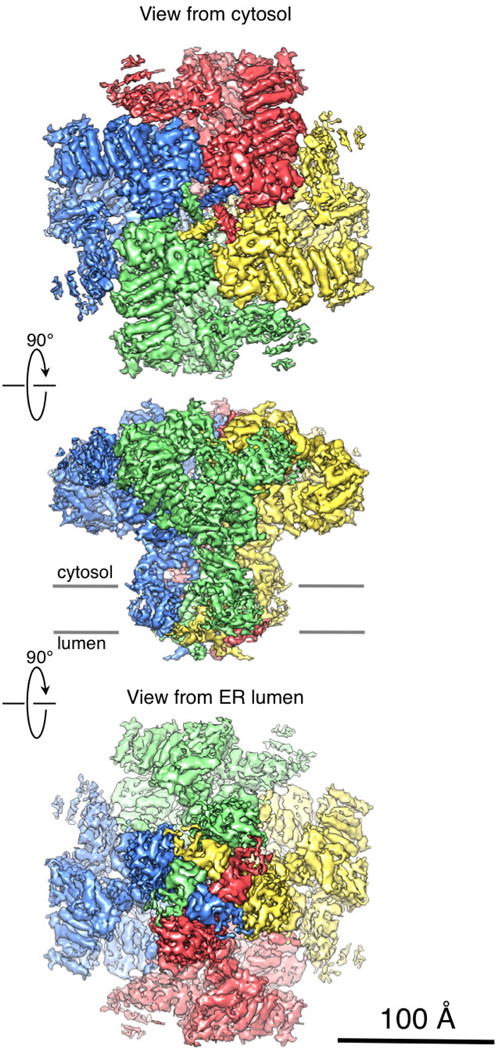
InsP3R1 viewed from the cytosol (top), along the membrane plane (middle) and from the lumen (bottom). Four individual subunits are colour-coded. The map is rendered at a threshold level corresponding to a molecular mass of ~1.3 MDa.