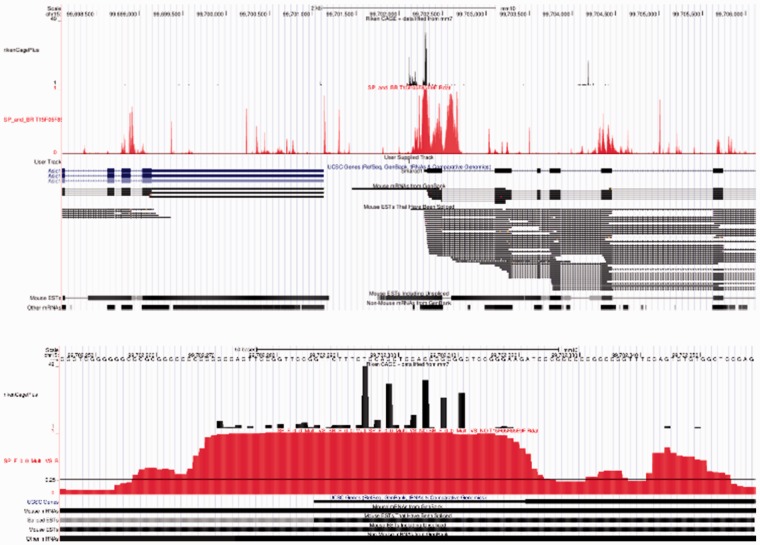
Fig 4.
Example of TIPR gene scan on 8 kb region of sequence. This figure shows the TIPR ALL model used to predict TSSs in the 8 kb region (top) and 100 nt region (bottom) surrounding the gene Smarcd1. The top track (black) displays the alignment of TSS-Seq (CAGE) reads along chromosome 15 of the M. musculus genome (CAGE tag cluster T15F05F85E9F). The second track (in red) is the probability output from the TIPR ALL model. The expanded track below the TIPR shows that Mouse ESTs align well with TIPR’s predictions. Some additional TIPR predictions are located near other CAGE tag clusters or ESTs

