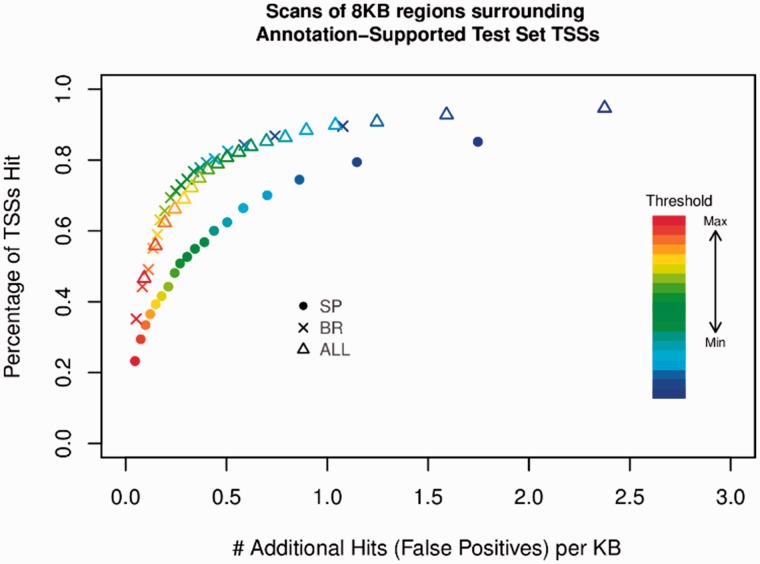
Fig 5.
Performance of all classifiers during gene scanning. The accuracy of all classifiers when applied on a large scale to the entire testing dataset. The vertical axis shows the percentage of TSSs in the test set which are correctly predicted (TSSs). The horizontal axis measures the number of additional TSSs which are predicted (false positives). The color scale shows the probability cutoff threshold, the value the model prediction must be above to be considered a TSS

