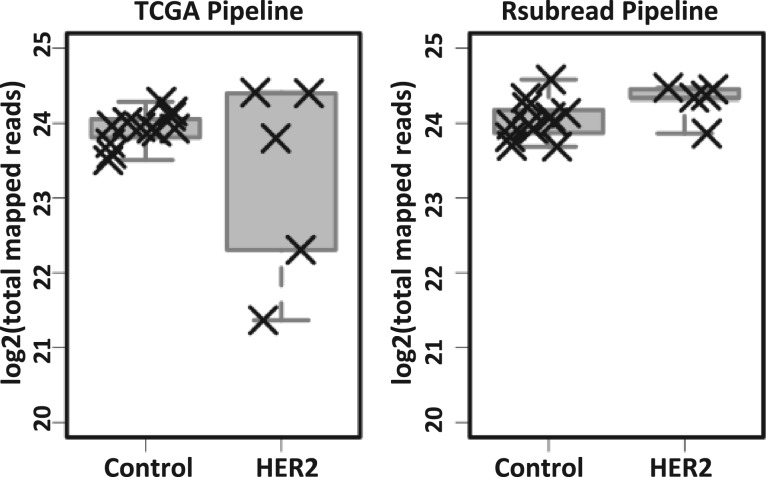
Fig. 2.
Total mapped reads per sample for data processed using the TCGA Level 3 and Rsubread pipelines. For the TCGA Level 3 pipeline, the number of mapped reads varied widely for the HER2 samples, and samples 2 and 4 (see Fig. 1) had a considerably lower number of mapped reads. In contrast, the number of mapped reads for Rsubread was consistent across the samples

