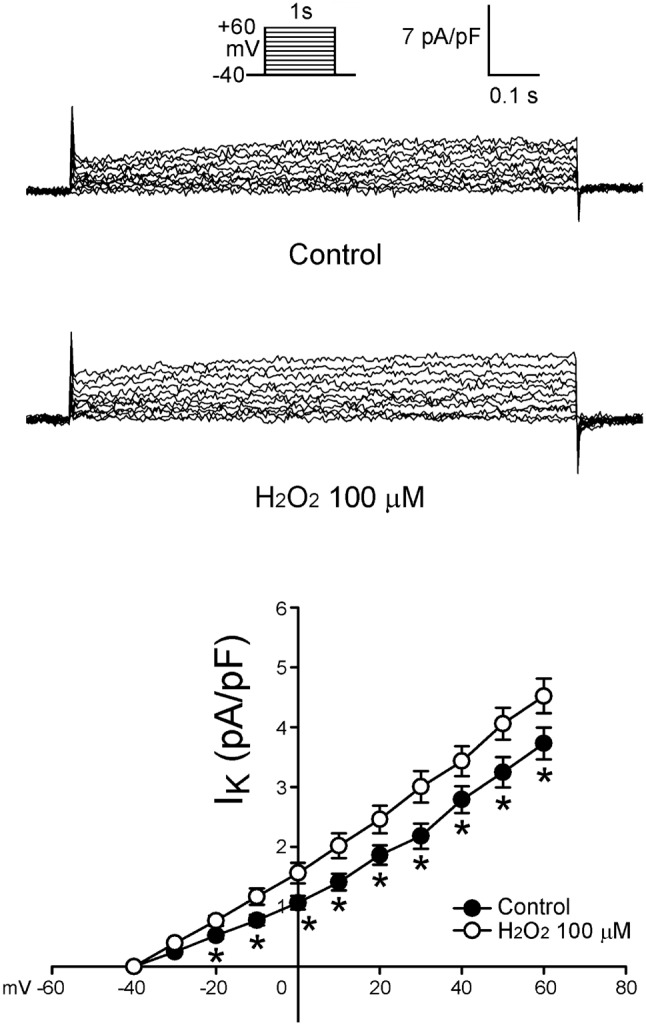
Figure 5.

Tracings and I-V relationship of IK in the atrial myocytes. Examples of tracing before and after the administration of H2O2 (100 μM) IK in atrial myocytes. The insets of the current traces show the various clamp protocols. The I-V relationship of IK of control (n = 25) and H2O2-treated (n = 25) in atrial myocytes. * p < 0.05 versus the control atrial myocytes.
