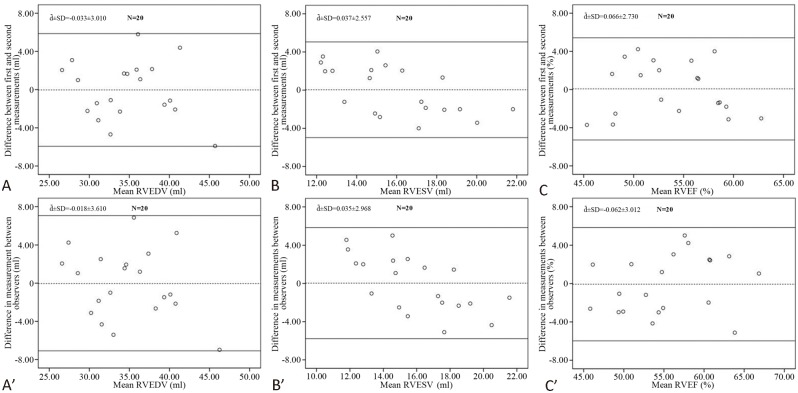
Figure 3.
Bland-Altman plots showing interobserver (A, B, C) and intraobserver (A′, B′, C′) differences and limits of agreement of RV variables measured by RT-3DE: The solid line represents the mean difference between the measurements analyzed by one observer or by two observers, and the dashed lines represent the 95% confidence interval for agreement, đ ± SD: mean ± standard deviation. RT-3DE, real-time three-dimensional echocardiography; RV, right ventricular; SD, standard deviation.

