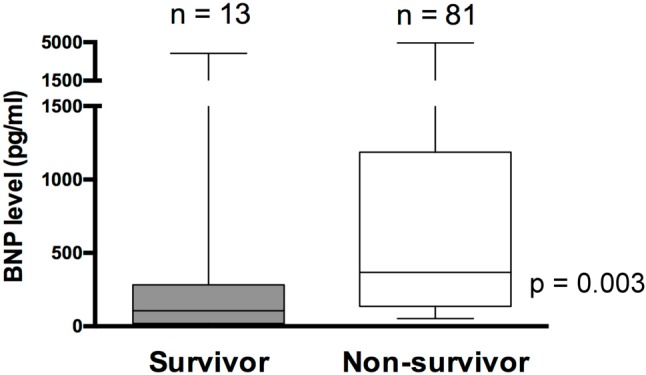
Figure 2.

Box plots showing the relationship of BNP to PICU mortality. BNP levels were higher in non-survivors. Boxes show the interquartile range with the midline indicating the median level. I-bars represent the highest and lowest values. Abbreviations are in Table 1; BNP, B-type natriuretic peptide.
