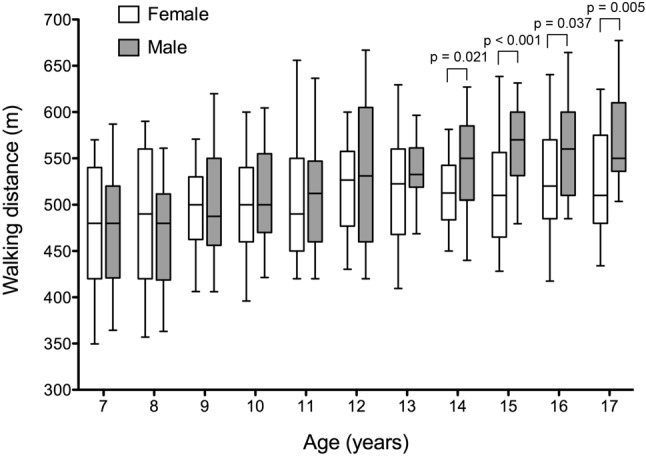
Figure 1.

Six-minute walking distance in male and female participants in each age group. Data are shown as box-and-whiskers plots illustrating the median, 25th and 75th centile (box) and 5th and 95th centile (error bar). p values refer to the difference between male and female participants in each age group. p values not shown indicate no statistical difference.
