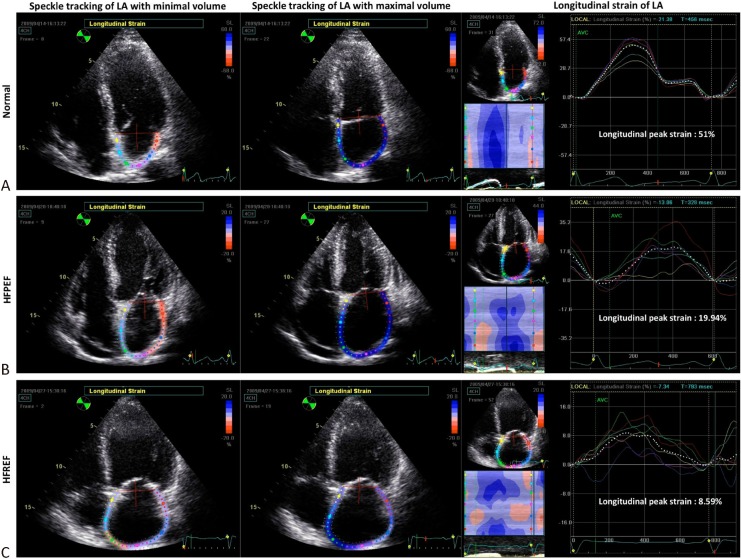
Figure 5.
Demostration of left atrial (LA) strains by speckle tracking imaging in different phenotypes of heart failure. Examples of LA longitudinal strains in three subjects of (A) normal, (B) heart failure with preserved ejection fraction (HFpEF) and (C)heart failure with reduced ejection fraction (HFrEF) were shown. The normal one had the highest global peak strain (51%) and the patient with HFrEF had the lowest global peak strain (8.59%). Global peak strain of whom with HFpEF (19.94%) had the values between them. The dotted white lines and colorized lines in the tracing represented global and regional strain respectively.

