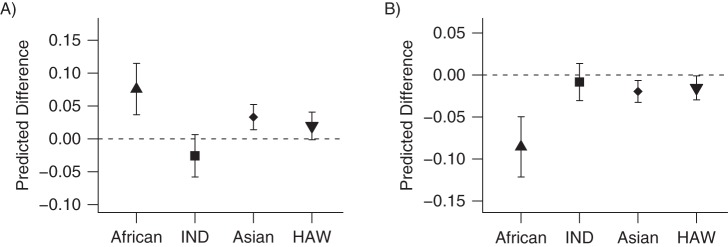
Figure 1.
Plots of predicted differences per 20% increase in 4 ancestries in the Multiethnic Cohort Study (1993-present) after adjustment for lifestyle factors for A) free cotinine (cube root) and B) cotinine glucuronidation. The vertical bars represent 95% confidence intervals for predicted differences. HAW, Native Hawaiian ancestry; IND, Amerindian ancestry.

