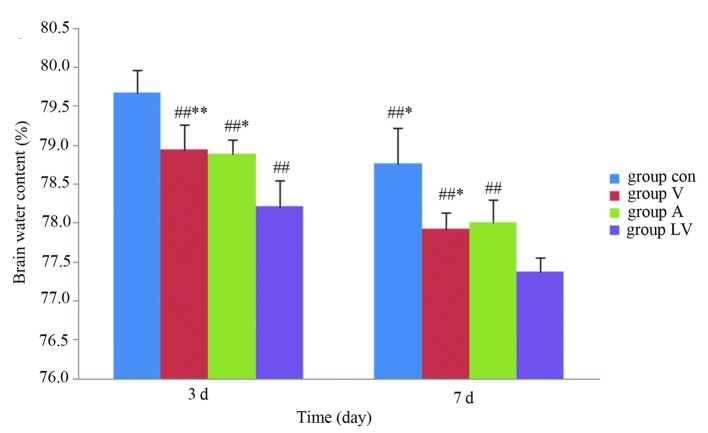
Figure 9.
Brain water content of each transplantation group. Data are presented as the mean ± standard deviation. #P<0.05 vs. the Con group; ##P<0.01 vs. the Con group; *P<0.01 vs. the LV group; **P<0.05 vs. the LV group. Con, control; V, femoral venous infusion; A, intra-carotid administration; LV, lateral ventricle administration.

