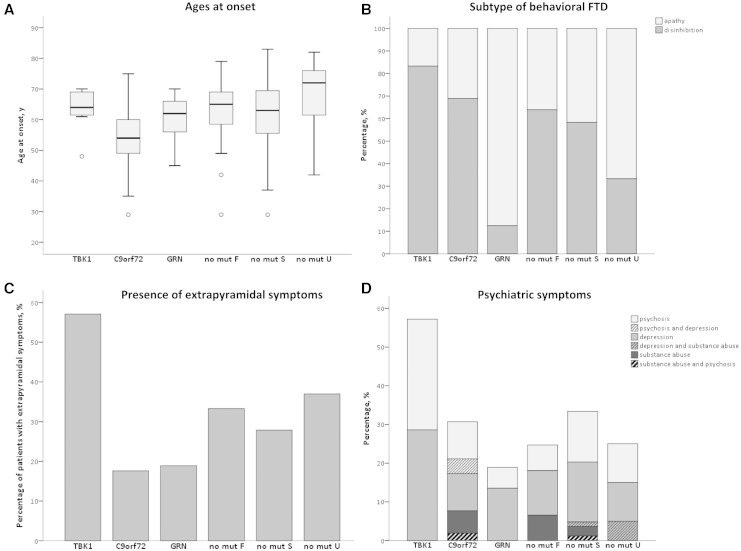
Figure 4.
Genotype–phenotype correlations in FTD patients. In these graphs, FTD patients are divided in groups based on their causal gene mutation, i.e. TBK1, C9orf72 and GRN carriers and non-mutation carriers. The latter group is further divided by familial history in familial and sporadic, and patients with unknown familial history. (A) Ages at onset. The boxplots illustrate the distribution of ages at onset in each FTD patient group. For each genetic subtype a boxplot is created in which the middle horizontal line represents the median age at onset. The upper and lower border of the box represent the value of the first quartile (25%) and the third quartile (75%) of the data. The whiskers represent the minimal and maximal age at onset with exception of the outliers. The outliers are presented as circles and refer to ages at onset that are greater than 1.5 interquartile ranges away from the 25th or the 75th percentile. (B) Subtype of behavioural FTD. This bar graph illustrates which proportion of the behavioural variant FTD patients of each patient group has frontal disinhibition or apathy as predominant feature, respectively. (C) Presence of extrapyramidal symptoms. In this bar graph, the proportion of patients who exhibit extrapyramidal symptoms are pictured for each patient group. (D) Psychiatric symptoms. This bar graph shows the proportion of FTD patients with psychiatric symptoms for each patient group. The bars are subdivided for the proportion of the major psychiatric characteristic.

