Figure 2.
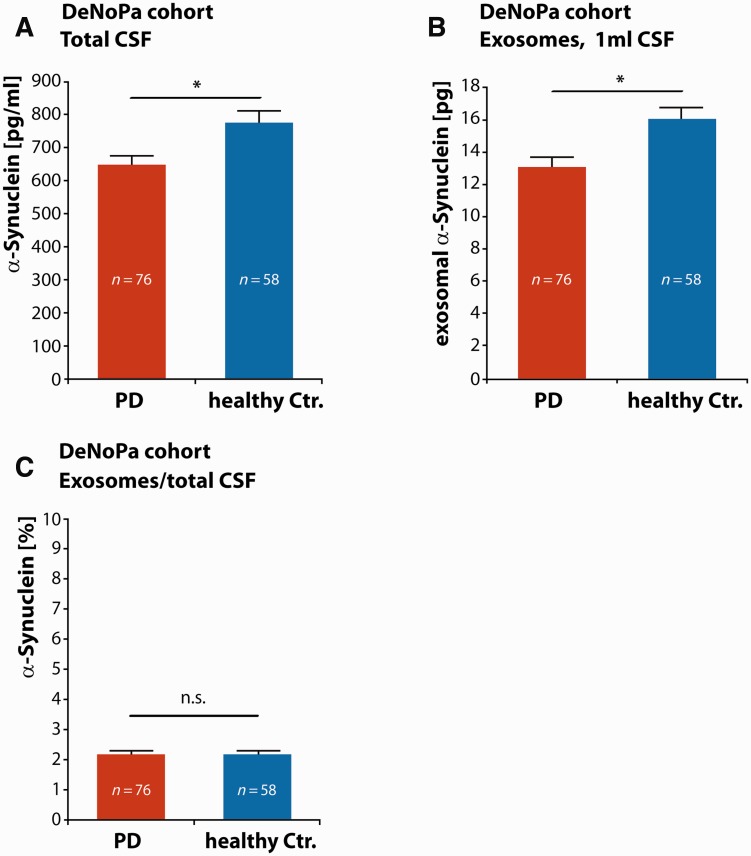
Quantification of exosomal α-synuclein in CSF samples from the DeNoPa cohort. (A) CSF concentrations of α-synuclein in total CSF were determined [red bar: Parkinson’s disease (PD) patients, blue bar: healthy control patients], n = 76 Parkinson’s disease patients, n = 58 healthy control patients, *P < 0.05, two-sided Student’s t-test. (B) Exosomal α-synuclein protein levels were quantified in exosomes prepared from 0.5 ml CSF starting material and levels were normalized to 1 ml (red bar: Parkinson’s disease patients, blue bar: healthy control patients), n = 76 Parkinson’s disease patients, n = 58 healthy control patients, *P < 0.05, two-sided Student’s t-test. (C) The ratio of exosomal α-synuclein (prepared from 0.5 ml CSF and normalized to 1 ml) to α-synuclein in total CSF (normalized to 1 ml) was determined in samples from patients with Parkinson’s disease (red bar) and healthy controls (blue bar) and is given in %, n = 76 Parkinson’s disease patients, n = 58 healthy control patients, n.s. = not significant, two-sided Student’s t-test.

