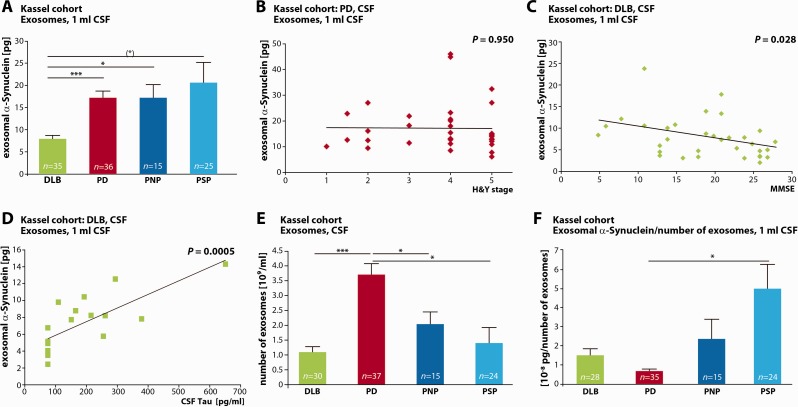
Figure 3.
Characterization of exosomal α-synuclein in dementia with Lewy bodies, Parkinson’s disease and non α-synuclein-related disease controls in the Kassel cohort. (A) Quantification of exosomal α-synuclein protein content. Exosomes were prepared from CSF samples from patients with dementia with Lewy bodies (DLB, green bar), Parkinson’s disease (PD, red bar), polyneuropathy (PNP, dark blue bar) and progressive supranuclear palsy (PSP, light blue bar), n = 35 DLB, n = 36 PD, n = 15 PNP control, n = 25 PSP control. (*) P = 0.05, *P < 0.05, ***P < 0.0005, Games-Howell post hoc test. One-way ANOVA P = 0.000691. For ROC curve analysis, see Supplementary Fig. 2 andSupplementary Table 3A. (B) Exosomal α-synuclein amounts do not correlate with the severity of motor symptoms determined by Hoehn and Yahr staging (H&Y) in Parkinson’s disease (n = 36, Pearson’s correlation coefficient r = −0.011, P = 0.950, two-tailed probability). (C) Correlation of CSF exosomal α-synuclein with impaired cognitive function in patients with dementia with Lewy bodies. Cognitive state was measured by MMSE (lower scores indicate a decrease in cognitive function) (n = 32, Pearson’s correlation coefficient r = −0.382, P = 0.028, two-tailed probability). (D) Correlation of CSF exosomal α-synuclein with increasing levels of CSF total tau indicating more progressed neuronal degeneration in patients with dementia with Lewy bodies (n = 17, Pearson’s correlation coefficient r = 0.751, P = 0.0005, two-tailed probability). (E) The number of exosomes per ml CSF was quantified by nanoparticle tracking analysis in CSF from patients with dementia with Lewy bodies (green bar), Parkinson’s disease (red bar), polyneuropathy (dark blue bar) and progressive supranuclear palsy (light blue bar) (n = 30 DLB, n = 37 PD, n = 15 PNP, n = 24 PSP, *P < 0.05, ***P < 0.0005, Games-Howell post hoc test. One-way ANOVA P < 0.0001). (F) Ratio of exosomal α-synuclein to number of exosomes in CSF from patients with dementia with Lewy bodies (green bar), Parkinson’s disease (red bar), polyneuropathy (dark blue bar) and progressive supranuclear palsy (light blue bar) (n = 28 DLB, n = 35 PD, n = 15 PNP, n = 24 PSP, *P < 0.05, Games-Howell post hoc test. One-way ANOVA P = 0.000377). For ROC curve analysis, see Supplementary Fig. 2 andSupplementary Table 3B.

