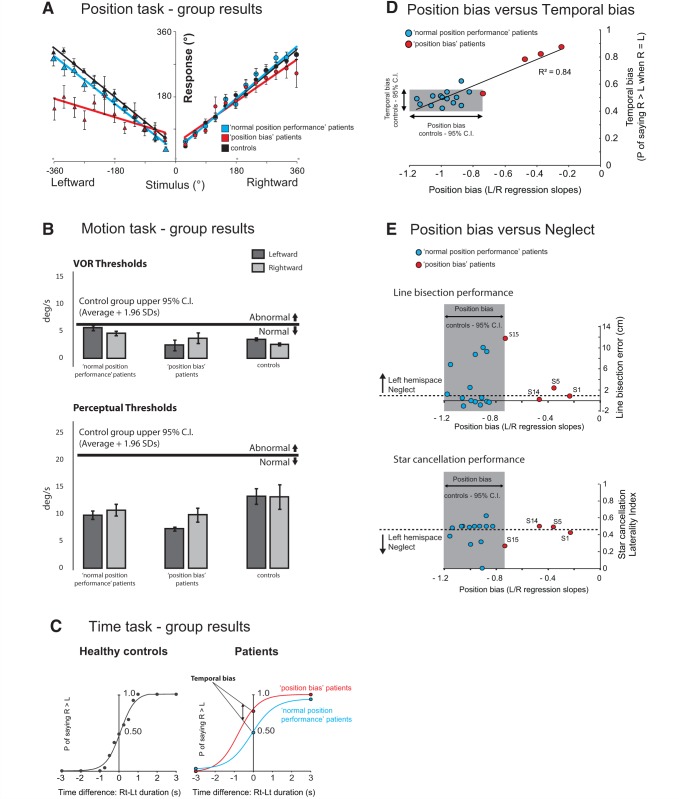
Figure 2.
Behavioural results. (A) Position task results. Grouped response–stimulus position performances are shown for the four patients with a spatial deficit (Patients S1, S5, S14 and S15) (red; ‘position bias’ patients), patients with normal spatial performance (blue; ‘normal position performance’ patients) and age-matched controls (black). Position bias was calculated for each patient from the patient’s response–stimulus position performance regressions, by dividing the leftward regression slope by the rightward regression slope. Vertical bars represent standard errors of the mean. (B) Motion task results. Angular velocity thresholds (°/s) for ‘position bias’ stroke patients, and ‘normal position performance’ stroke patients, for leftward and rightward rotations. Vertical bars represent standard errors of the mean. The thick horizontal black line delineates the upper limit (group average + 1.96 SD) of the healthy control group motion perceptual threshold. (C) Time comparison task results. The temporal bias was obtained by calculating the probability of saying that the rightward rotation was of longer duration than the leftward for healthy controls (black), ‘position bias’ stroke patients (red) and ‘normal position performance’ stroke patients (blue). (D) Correlation between bias in the Position task performance and temporal bias in the Time comparison task across all stroke patients (red circles = ‘position bias’ stroke patients; blue circles = ‘normal position performance’ stroke patients). The coefficient of determination (r2) relates to all the data points. The shaded region shows the control group’s 95% CIs (95% CIs = average ± 1.96 SD) for position bias (x-axis) and temporal bias (y-axis). (E) The relationship between position bias and neglect. The normal control group’s 95% CIs for a position bias is shaded and four patients (red) have position biases outside of this normal range. For star cancellation performance, laterality index was calculated by dividing the total number of stars observed in the left hemispace by the total number of stars found. Values below 0.46 signify the presence of left neglect (http://www.strokengine.ca/assess/sct).

