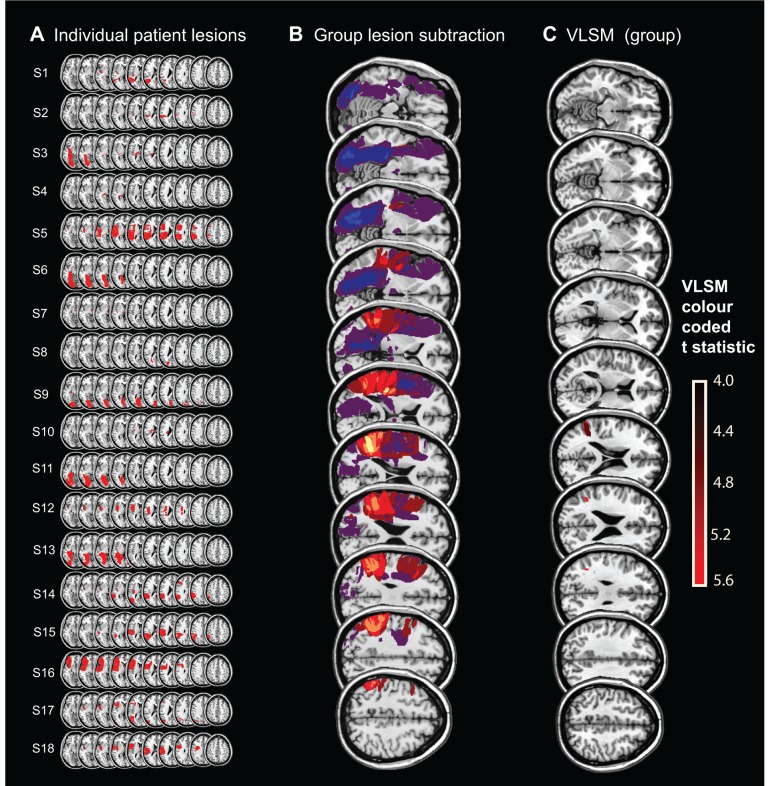
Figure 3.
Brain lesion maps and analysis. (A) Lesion map of all stroke patients (Patients S1–S18). (B) Lesion subtraction analysis for Patients S1–18 localized the Position task deficit to the temporoparietal junction (TPJ) shown in yellow. (C) VLSM analysis. For the VLSM, a t-test was performed at each voxel (using 1000 permutations and a P-value of 0.05) only in voxels that were damaged in at least three individuals. The bar on the far right gives the colour coding for the significance level for the VLSM analysis (units = t-values and only voxels with t > 4 are displayed). The most significant regions were in the angular gyrus (MNI: 38, −53, 30 to 43, −53, 24; t = 5.16) and just reaching the superior temporal gyrus (60, −53, 20), with further less significant voxels in the middle temporal gyrus (48, −51, 20; t = 4.62).

